The Bitcoin all time high - 3 Bitcoin indicators to consider
- 7 minute read

Many Bitcoin followers were calling it, October was going to be a spectacular month for BTC and was even dubbed ‘Uptober’. 50k and 60k were seen as ‘doable’ and PlanB was already preparing for a new all-time-high. His prediction came true, as Bitcoin reached a price of $67,276 on the 20th of October. After a small dip, the support range of BTC did not drop below the 60k mark. Thus comes the big eternal crypto question on everyone’s lips: what’s next? In today’s article we will take a look at three indicators that may be important in the upcoming weeks.

Bitcoin ETF’s
For those who have missed it, Bitcoin ETF’s have been launching these past few weeks. ETF is short for Exchange Traded Fund and encompasses an asset that can be traded on a traditional stock exchange. It’s more a traditional investment fund that focuses on diversification to reduce the risk. Bitcoin funds for the old school trader. A lot of American exchanges have been trying to get Bitcoin ETF’s approved and the SEC (the American financial authority) finally greenlighted most proposals. With the first approval initiated, the Bitcoin price went up and many exchanges were getting ready to start. Proshares was the first to launch, shattering an 18-year old record for fastest fund to reach a billion dollar in assets under management (AUM). The record was reached after just two days of trading and was reminiscent of the first gold EFT that launched in 2004. The second ETF, launched by Valkyrie, began trading on Nasdaq (the second most popular stock exchange in the USA).
More ETF’s will launch in the upcoming weeks, starting this week’s launch of VanEck. However, the SEC is known for being conservative and thus taking their time. At the moment a handful of ETF’s are awaiting approval but only time will tell when they will definitively launch. Always keep an eye on the latest approval news, the current Bitcoin price and market sentiment. These three combined can be great indicators for Bitcoin’s next move.
How does holding #BitcoinFutures differ from holding #Bitcoin directly? Learn more in our quick Primer on Bitcoin Futures: https://t.co/EwLDf6xPxF pic.twitter.com/XKuCzPkEpG
— VanEck (@vaneck_us) October 19, 2021
Fear and Greed Index
Speaking of such indicators. Ever heard of the Fear and Greed Index? It’s a tool that is used by investors worldwide to measure the market sentiment at that moment. The index basically works on the premise that markets can perform above expectations when people are fearful and stocks are being overvalued when people are greedy. The stock market Fear and Greed Index is based on factors such as market volatility and stock price momentum. As you can expect, there is also a Bitcoin Fear and Greed Index where they ‘analyze emotions and sentiments from different sources and crunch them into one simple number’. Simply put, you should be wary when the Index is flashing ‘Greed’ because a market correction might occur. With ‘Fear’ it works the other way around and may provide investors with a decent buying opportunity.
An important indicator for the upcoming weeks can be found by checking the Fear and Greed Index. Why you might ask? Because the Index has been signaling ‘Greed’ a lot for the last three months. According to the Index, a correction has been long overdue (although that correction might have occurred when this article was published). But Bitcoin keeps persisting, displayed in the huge buy wall that happened after its all-time-high. Is the Index outdated? Could be. It could also mean that bigger institutions and exchanges are getting more and more invested in Bitcoin, resulting in a relatively high price. As long as the Bitcoin price rises, while the Index displays ‘Greed’, experts predict that the market is ready for a longer bull run. Keep an eye out though for the ‘Extreme Greed’ territory, as the momentum can shift extremely fast in the world of cryptocurrency.
Shades of 2017
After the all-time high of $67,276, Bitcoin quickly made a 10% dip. Experts were predicting that the price would drop to 50k in certain bearish-scenario’s. However, it seemed that a lot of buy orders were pegged at the 60k mark, indicating a new support level. As the week came to a close, Bitcoin was hovering around that 60k mark. Historically speaking, the price tends to do better on Monday and on the 25th of October Bitcoin shot up towards the 63k mark, making PlanB’s predictions pretty accurate.
Aug>47k✅
— PlanB (@100trillionUSD) October 1, 2021
Sep>43k✅
Next targets: Oct>63k, Nov>98k, Dec>135k🚀 pic.twitter.com/C45nfQkQSC
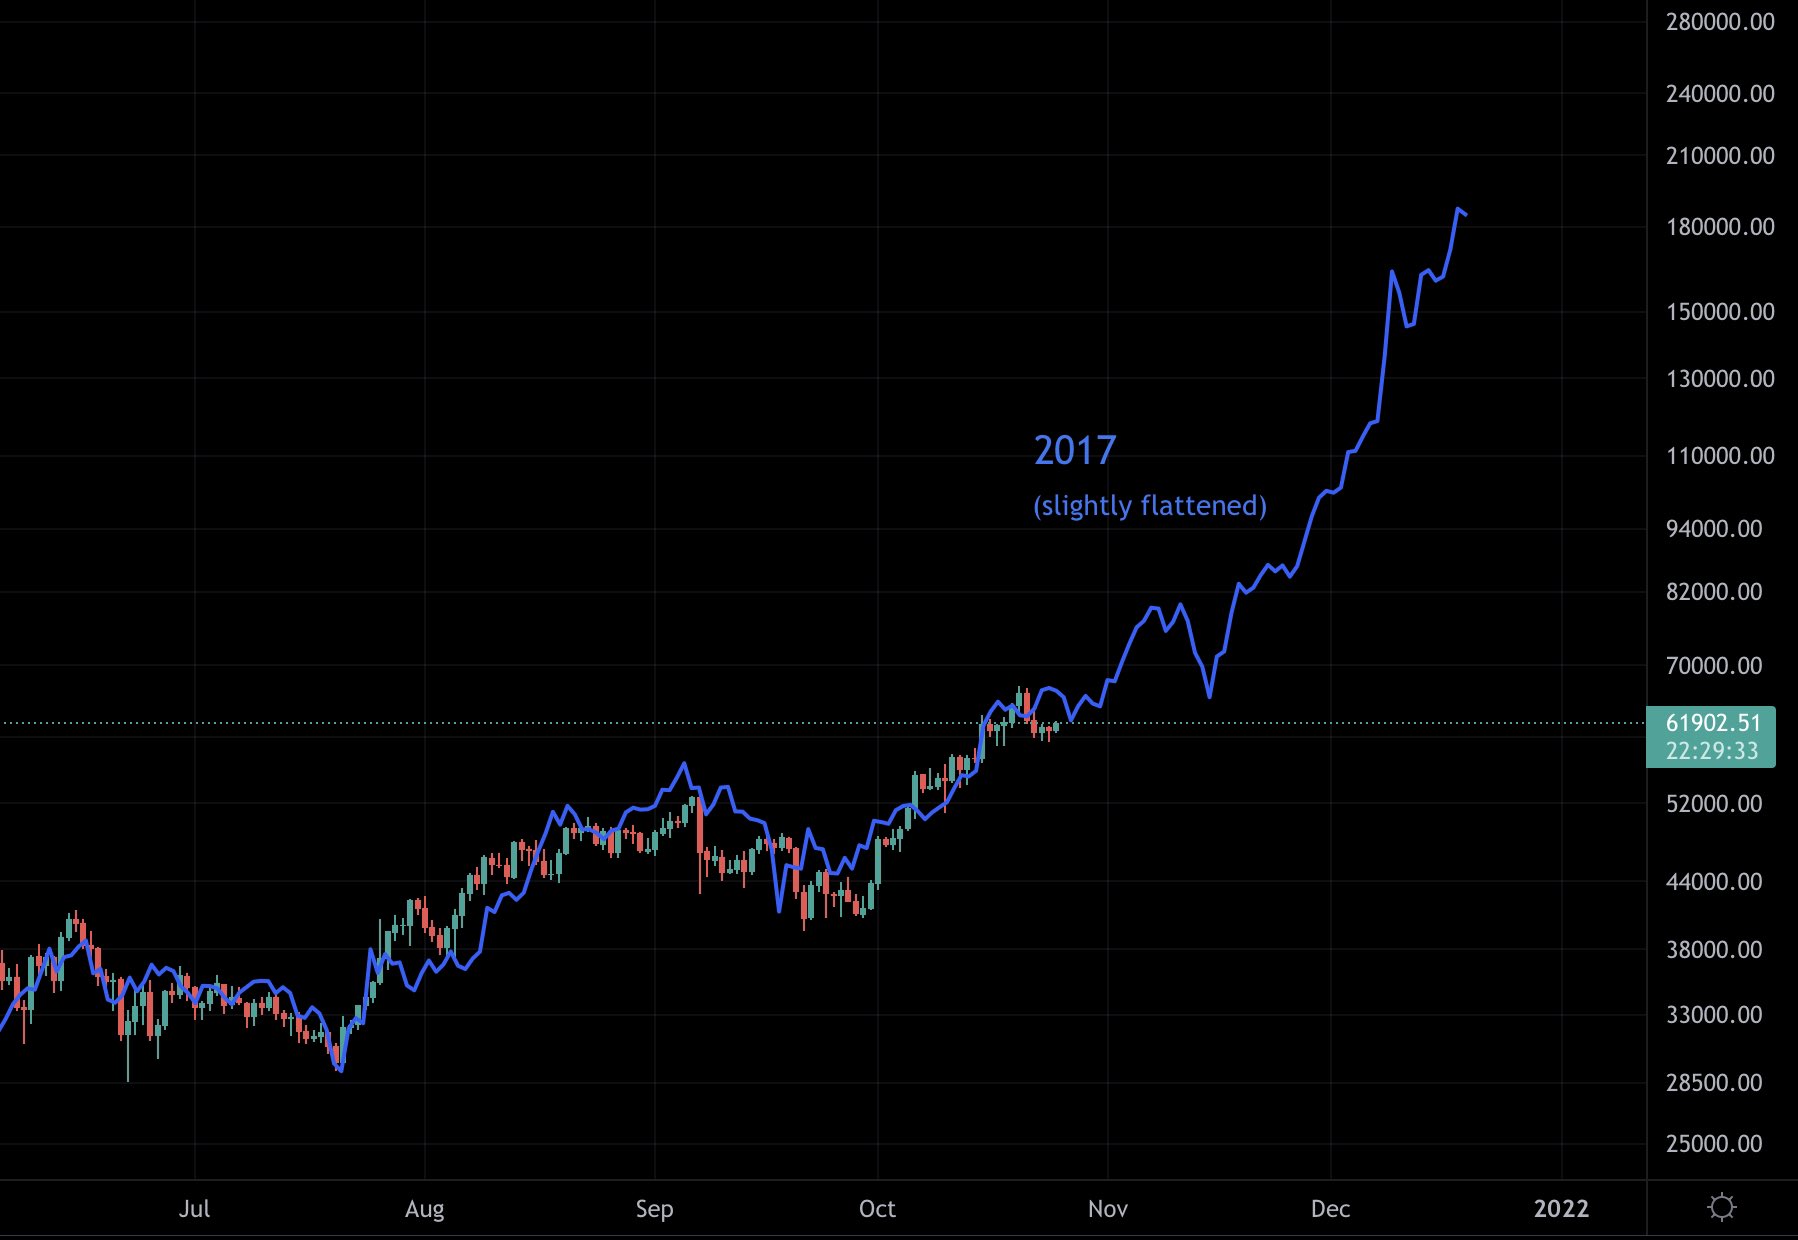
But what should we focus on next? With a new all time high in sight, Bitcoin is heading towards uncharted territory. One bullish scenario is highlighted by TechDev, a popular crypto analyst. TechDev made an overlay of 2017’s Bitcoin price graph and placed it on the current chart. The result? The last 140 days of 2017 and 2021 are almost identical to each other, following the same day-to-day structure. TechDev mentions that the overlay predicts the price better than any technical analysis he has seen so far, although he does mention that he flattened the fractal a bit, meaning that 2017’s overlay was more vertical. Even so, predictions on Bitcoin for the upcoming months are looking quite positive should the chart continue to be similar.

Where is the key support level for $BTC?
— Ki Young Ju 주기영 (@ki_young_ju) October 25, 2021
$840M worth #Bitcoin was purchased in futures markets via market orders whenever the price approached $60K yesterday.
Taker Buy/Sell Volume helps to figure out key support/resistance levels.
Set an alert here👇https://t.co/URSHem9Swb pic.twitter.com/ygh4KQAOVg
Conclusion
Anycoin Direct does not give any financial advice, nor would we ever predict what the price is going to be. We do, however, look at certain indicators so that you at home can look at them as well. In this relatively new market we try to be as educative as possible so that everyone (including us) can learn in this fast moving market.


