What are trading indicators
- 15 minute read

In technical analysis a trading indicator provides an indication where the price of a crypto might move. An indicator is a mathematical derivative of quotes. Investors use indicators so they can best predict price movements.
Another aspect of the indicator is warning of a trend reversal or confirming the direction of the price. After using your own chosen indicators for a long time, you can eventually learn the art, because it is not an exact science. If it were, everyone would know what to do and which indicators to use, and volatility would be greatly reduced.

- A trading indicator is used to get an indication of future price development of a cryptocurrency, so you trade less emotionally
- Popular indicators are more influential because many investors use the signals from them, which influences the price of a crypto
- It is best to use popular indicators that complement each other in some kind of trading system
- Technical indicators can be divided into leading and lagging indicators or a combination of the two
- Choosing an indicator should suit your investment strategy
- TradingView as well as exchanges and brokers have a lot of indicators in their arsenal
- Most indicators existed in stock trading before the first cryptocurrency entered the market
- The best indicators for you should fit your strategy and be widely used
- If you are going to invest, you will need to know how trends, hypes, resistance and support work
- When day trading you need to use different indicators than when swing trading
- There are mainly advantages of using an indicator, besides some disadvantages
Table of Contents
- Why do you use an indicator?
- What types of indicators are there?
- Where do you use a trading indicator?
- What are the most popular indicators?
- Where do indicators come from?
- Which indicators are the best?
- What is trend, hype, resistance and support?
- How many indicators can you use?
- What indicators are useful in day trading?
- What indicators are useful in swing trading?
- Advantages and disadvantages of using indicators
- Conclusion
Why do you use an indicator?
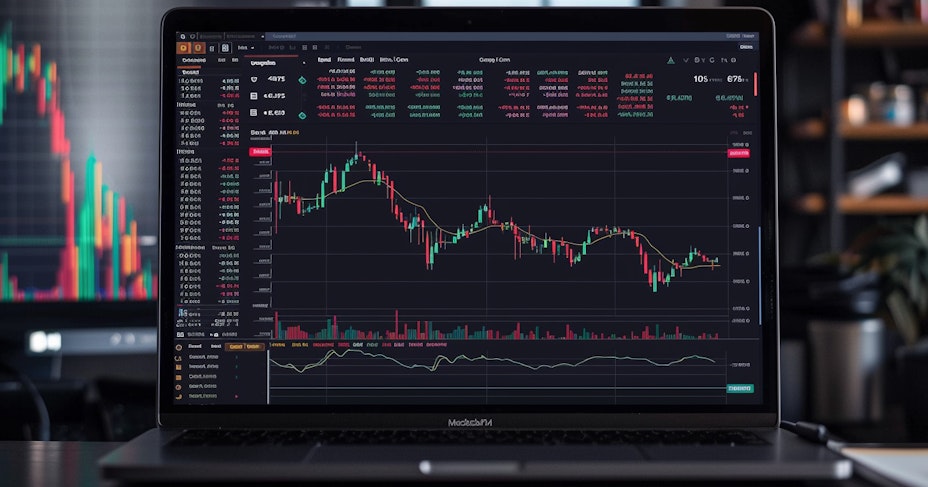
You use an indicator to gain insight into historical price levels and additional data, with the goal of gaining an objective understanding of the background to price movements and preparing for future price movements. You can then buy and sell cryptocurrency based on unbiased sources.
Common indicator
Another valid reason to use an indicator is popularity. Suppose half of the investors use indicator X. If X shows that this is a good time to buy, then a lot of people will do so. As soon as a lot of people buy, the price goes up. Therefore, it is good to know which indicators are used the most so you don't miss out on this selffulfilling prophecy. The herd mentality is an important part of cryptocurrency trading.
Turning off emotions

When trading volatile assets, such as stocks and especially cryptocurrencies, people tend to act irrationally and emotionally, making decisions that are inconsistent. This can lead to large losses. With the use of an indicator, you can avoid this, if you simply follow the directions of such an indicator.
Trading System
Some investors turn it into a kind of trading system by using multiple indicators for their buying and selling. In doing so, they always use the same trading strategy with the goal of making profits often enough to see their wealth grow over time. Their goal is to beat the market, that is, achieve above-average results.
When good investors start working with a new indicator they first use backtesting, to see what results this indicator would have produced in the past if you had done exactly what the indicator told you to do. There is specialized software for this. They then naturally take the indicators that had produced the best results and can then start fine-tuning to set the parameters of those indicators so that the potential gains will be optimal. Another strategy is to work with small amounts in the beginning and as your results improve with larger ones.
"Never, ever argue with your trading system"
What types of indicators are there?
There are two main varieties of indicators. You have the technical and the fundamental indicators . For this article, the fundamental are not applicable, these include macroeconomic data such as interest rates , unemployment rates or inflation , as well as fundamental analysis. However, we will separate the types of technical indicators for this article.
There are leading and lagging indicators. Leading indicators try to predict where the price is headed and indicate momentum, while lagging indicators should provide some kind of historical record of the circumstances that led to the current price and confirm a trend.
The leading indicators:
- Relative strength indicators measure oscillations (fluctuations or tremors) in buying and selling pressures. They usually display numbers between 0 and 100, allowing you to see at a glance when a cryptocurrency is overbought (close to 100) or oversold (close to 0).
- Momentum indicators analyze the speed of price changes over time.
The lagging indicators:
- Trend indicators show whether a market is moving up, down or sideways.
- Mean reversion indicators, which roughly means that prices tend to return to their long-term average. These indicators show how far a price swing will stretch before a reversal will occur and the price will move back toward its mean.
Volume indicators are leading or lagging. They add up all trades and indicate how significant price changes are. A 5% price change at very high volumes will have more impact than one of 10% with very low volumes.
It is useful to use different types of indicators so that you do not measure more or less the same thing all the time.
What kind of indicator you use depends mainly on what kind of trader you are. For example, delayed indicators are of little use if you are a day trader. Similarly, if you are a swing trader and trade in longer time frames, you have little use for statistics of indicators per 5 minutes.
Where do you use a trading indicator?
You can use a trading indicator in quite a few places to give you information before you make an investment.
TradingView in technical analysis
A widely used software environment where you have a large collection of indicators at your disposal is TradingView. It's free to start with, although you can only turn on a few indicators at a time. Fortunately, you also don't really need more for technical analyses .
On the site of TradingView you can choose from as many as 100 indicators. It would be helpful if you already know a bit about which ones you want to test there, because otherwise you will quickly lose the overview. It remains one of the most convenient and well-organized sites in the field of indicators, which is why many professional and advanced traders use it.
Indicators at brokers or exchanges
Almost every exchange and broker also provides you with the most commonly used indicators, which you can turn on and off. Turn at least a few of them on when you're watching the development of an individual cryptocurrency's price, so you can get an idea of what they can do for you, even if you're not working with them yet.
So if you get to a place where indicators are not available, you can still look at other sites for market analysis before buying or selling.
What are the most popular indicators?
We will mention a few of them: Moving Averages, RSI, Bollinger Bands, Volume indicators, MACD, Fibonnaci Retracements, Stochastic Oscillator, Average Direction Index, On-Balance Volume and the Ichimoku Cloud. Later we will explain most of these.
Where do indicators come from?
Most indicators were invented in the last century and come from stock trading. Traders have always needed indicators they can use to get more structure into their trading and trade less based on human emotions.
Candlesticks also have a whole system, using clues from the market (such as a head and shoulders pattern) to get a handle on the future of a commodity or stock. Candlesticks are much older than indicators.
Which indicators are the best?
Everyone who works with indicators will give a different answer to this question. After all, you use an indicator for a particular purpose. Therefore, it would be better to ask which indicators best fit your purpose. Then you look for an indicator from that group that you get the best results with.
The rationale for choosing a technical indicator

Since we are dealing with herd behavior, it is good to know which is a commonly used indicator, so that a signal from such an indicator is also much more significant than a signal from a rarely used niche indicator.
It is impossible to find out about the exact numbers of users for various indicator types, unless you start sending out questionnaire to all traders. Even then, we would only roughly know what different indicators are most commonly used, so you can take that into account when you go pick one that fits your investment strategy.
We will only briefly explain commonly used indicators, since you could write books with a in-depth analysis of each. The most commonly used indicators in relatively random order are:
- Relative Strength Index (RSI).
The term RSI was coined by J. Welles Wilder in 1978 and is now one of the most well-known indicators in the crypto world. Of course, at the time, it was coined for the stock market. However, RSI can also be used perfectly well for the crypto market. It is used to determine the strength and potential reversal points of a current price trend.
It is an oscillator (indicating oscillating movements) and measures 14 periods by default, which you can set as you wish. For example, these can be 14 hours, 14 minutes, or 14 days, as needed. The RSI graph is divided into three zones: below 30, between 30 and 70 and above 70. Below 30 (out of 100) a cryptocurrency is oversold, the middle zone is a no trade area and above 70 it is overbought. An oversold situation counts as a buy signal, an overbought situation is a sell signal. So you can see at a glance what you could do according to the RSI.
The formula of RSI is 100 - 100/ (1 + average rise/ average fall). Of course, since the indicator calculates it itself, you don't have to do this yourself. But you now know how it is calculated. A real disadvantage of RSI is that it does not include volumes, so you can get a very distorted picture.
- Moving Average Convergence Divergence (MACD).
MACD is indicator representing a moving average of convergence and divergence developed by Gerald Appel in 1970. MACD was also developed for the stock market at that time. When crypto became bigger, people started using it a lot there as well. MACD indicates momentum and trend.
MACD is an indicator that works with exponential averages, where data from the market from the recent past weighs in more heavily into the calculation than from longer ago. Usually two values are measured, the 12-day and 26-day average of a price, which together produce the MACD line in a chart. A signal line is also drawn in the chart, which is calculated by taking the exponential moving average of the MACD line itself. When the two lines approach each other it is called convergence, when they move further apart it is called divergence.
Once the signal line crosses the MACD line, this is an important signal according to MACD. The trend is about to reverse. If the signal line crosses above the MACD line this is considered a buy signal and vice versa. MACD has lost a lot of popularity in the financial markets since the year 2000 because it tends to be somewhat slow to react to changes in the market, so many investors who used MACD were late in reacting and lost a lot of money.
- Moving Average (MA)
A Moving Average uses two numbers that are compared. The higher the numbers, the longer the period over which you view the chart, the more clearly you can spot trends. For example, an MA 50 days - 200 days is a 50-day moving average compared to a 200-day moving average. Once these lines cross this is taken as a buy or sell signal. MA is also used to represent support and resistance.
Since you can choose which periods to use, MA allows you to display pretty precisely what you want to know. If you want to know 50 minutes - 200 minutes, you can do that just as well as hours, days or weeks. So it's a very flexible tool. There are several variations of an MA, such as Simple MA (normal average), Weighted MA, Exponential MA and the Centered MA, these differ mainly in which dates get more emphasis (usually the shorter ago the more important).
If the shortest period line crosses the longest period line it is a signal. If the shortest crosses below the longest it is a sell signal and vice versa. The longer the period, the more significant such a signal is. Many traders wait for a golden cross signal on the Bitcoin chart (50-200 day MA) to buy or a death cross (50-200 day MA) to sell. Historically, these often led to a bull or a bear market .
- Fibonacci Retracements
Fibonacci Retracements are used to determine resistance and support. Fibonacci ratios have been applied to stock price analysis, a concept that originated sometime in the 1930s. Personally, I call Fibonacci Retracements numerology for traders. Retracements are derived from the concept of the golden ratio, where each number is approximately 1.618 (hence the 61.8%) times the number before it, e.g., 34, 55, 89, 144. Two consecutive numbers added together is the next in the sequence.
In a Fibonacci chart, there are 6 lines. The value of these horizontal lines are 100, 0, 50 (average) and another 61.8%, 38.2% and 23.6%. According to the golden ratio, these 6 lines should indicate support and resistance. The Fibonacci sequence comes from observations in nature and actually has no logical underlying idea. If it is true in nature, it must also be true in technical analysis, of the same cloth. Some studies have shown that using points on the Fibonacci chart to open a trade did not produce significant results.

Since many people believe in alternative ways of thinking, the Fibonacci sequence has become very popular as a basis for trading anyway. If many people use it, results can also come simply because this group obediently follows the signals and the chart is correct due to the selffulfilling prophecy.
- Bollinger Bands
John Bollinger, an inventor, gave the name to this indicator. These Bollinger Bands form a band around a Moving Average based on volatility. John advises us to work with an MA period of 20 and a band factor of 2. The Bollinger Band is then calculated by multiplying the standard deviation of prices over the MA period by that factor (2).
As the volatility of a cryptocurrency increases the band widens, as it decreases the price becomes more stable and the band narrows. When the price moves outside the band it is a signal that the current trend is continuing. A top or bottom outside the band that is followed by a top or bottom within the band may indicate a trend reversal. A price movement that starts at one of the bands usually continues its path to the other band, traders use this to set price targets.
Buying and selling via a signal are simple with Bollinger Bands. If the price breaks through the lower band it is a buy signal and if it breaks through the upper it is a sell signal. You can see this immediately and that is one of the reasons it is popular. It is a strong visual indicator. 95% of the time the Bollinger Bands signals stay within the bands.
I myself am more of a fan of Classic Rock Bands, but if you like Bollinger, be my guest.
- Ichimoku Cloud
Since it is widely used I will say something about it. It was invented by Goichi Hosoda in 1930, a Japanese journalist who perfected this system over 30 years and showed it to the public in the 1960s.
The Ichimoku Cloud is a technical indicator used to identify trends, momentum and possible support and resistance levels on a chart. It consists of several components, such as the Kumo cloud that represents the balance between buyers and sellers.
It is somewhat similar to the Bollinger Bands in appearance, but it is a lot more complex. Not recommended for beginners, but the system is widely used to determine the buying and selling point.
- On-Balance Volume (OBV).
OBV is an indicator that tries to determine when to buy or sell based on traded volumes. Whereas many indicators merely monitor the price and thus can give false signals, OBV says much more about the significance of volumes leading to trends.
For example, selling 1 million coins costing 2 euros each is much more significant than selling 100 coins at 5 euros each. You can therefore see the OBV as a powerful indicator, complementing other indicators that do not take volumes into account.
The OBV will usually rise when prices rise, the accumulation phase. It will fall when prices fall, the distribution phase. The OBV usually shows convergence with the price chart. Once it becomes divergent it can indicate a buy or a sell signal.
If volumes increase steadily with no change in price, the OBV indicator will rise and predict that a price increase will occur soon. If OBV is falling while the price shows no change, it means that the cryptocurrency's price will fall in the near future.
- Money Flow Index (MFI).
The MFI reflects the flows of money when trading a specific cryptocurrency. It is related to RSI, but provides additional information on volumes. Like RSI, you get to see a chart from 0 to 100, where below 20 is oversold and a buy signal and above 80 is overbought and a sell signal.
The MFI combines price with volume. This makes it a more comprehensive indicator than merely indicating price or volume. The average price of a crypto (highest, lowest, close) is multiplied by the volume.

Positive divergence occurs when the MFI is rising while the price is falling. This is a signal that the bottom is in sight and the trend may reverse, causing the price to rise again, a buy signal. With negative divergence, the MFI is falling while the price is rising. The top should then be in sight and it is a signal to sell.
Other indicators
There are many more indicators, but this article is already a long sit. Take a look at TradingView to see how many there are. It may well be that you get much better results with another indicator, but remember that the most used ones also have the most influence, although every indicator will give you logical signals, otherwise they would not have been promoted to an indicator.
What is trend, hype, resistance and support?
A trend is a movement in the price of a cryptocurrency that persists long enough to call it significant. For example, if the price of a crypto is steadily declining by 25% over a period of time it is said that there is a downward trend.
Crypto hype
When a cryptocurrency suddenly skyrockets out of nowhere we are dealing with a hype. You see this a lot with meme coins , which can rise hundreds of percent over the course of days, but drop just as quickly. Hype can also develop around certain types of cryptocurrency, such as DeFi past and present AI coins. Large profits can then be made in a very short time, which can disappear as quickly as snow under the sun when attention wanes.
Resistance
In technical analysis you also have to deal with resistance and support, which are provided to you by the indicators. The resistance is at the top of the chart, where you see that a higher price is always "rejected" by a symbolic wall. Every time the price goes in that direction the price starts to fall again, also because traders now know the resistance and can then start selling, making it a kind of selffulfilling prophecy.
Support
Support works in reverse. Once the price moves to a certain lower value, the price keeps going up. This bottom is then the "signal" for traders to buy. Resistance and support are widely used by traders in swing trading, where support is taken as the buying point and resistance as the selling point.
"There is a time to go long, a time to go short and a time to go fishing."
How many indicators can you use?

This partly depends on your preference, but in general it is better to use more than 1 and not more than 3. If you use only 1 indicator you often have too little information, if you use more than 3 you will be overloaded with information, making it difficult to see the forest for the trees.
If you get good results with a combination of a few indicators, it is best to keep working with them, as you will eventually become an expert in them and see at a glance what you could be doing. Additional or complementary indicators, when combined, say more than similar ones. Don't change indicators too often, as you will have to start dissecting them all over again and understanding them completely.
What indicators are useful in day trading?
Day trading is very stressful. Therefore, you need to know exactly what to do to stay in control. Therefore, use as few indicators as possible, which you know completely by heart. Set the profit to be taken against the stop loss so that you have to be right in less than 50% of the cases, between 30% and 40% is fine.
If you are going to day trade, an indicator that shows volume is very useful. If volumes are rising it is a sign of strength. If the market is falling and high volumes suddenly appear then the trend can reverse. If a crypto continues to rise, but volumes get lower then this trend may reverse and the price may start to fall.
Many day traders also use the Volume Weighted Average Price (VWAP). This is the average price of a cryptocurrency based on price and volume. If a crypto is below the VWAP, it is bearish and is a sell signal and vice versa. Many large investors use this and so this lets you know what the large funds may be up to.
The 9 (period, say minute or 3-5 minute) Exponential Moving Average (9 EMA) represents the average price of the past 9 candlesticks. Most prices stay very close to this 9 EMA, so a deviation is easily noticed and based on that you can place a trade.
A combination of this is trading with 9 EMA and 30 WMA (weighted average). With a long you buy when the 9 EMA is above the 30 WMA and a candle closes below the 9 EMA. You then buy below the low of this candle and sell with a predetermined profit percentage. When going short you do the opposite.
"Letting losses run is the most serious mistake made by most investors."
What indicators are useful in swing trading?

When swing trading you will need to know the support and resistance to determine a good entry point. One of the big advantages of swing trading is that you can make a trade without much fuss and that afterwards you can do something else for a while. A disadvantage is that you have fewer hits, but these hits do yield more than with day trading. Also with swing trading you should have a stop loss percentage of around 35:100, so you should be right about 2 out of three times to statistically make a profit.
The Moving Average (MA) is a moving average that tracks the price trend of a cryptocurrency. If you enter a shorter and a longer term in your indicator you get two lines, which can cross each other. For example, if you take 20/ 50 day MA and in addition 50/ 200 day MA and the short crosses the long upwards, then the short-term trend is bullish and vice versa. The chart usually indicates this with a cross, so you know exactly when the turning point is and you could do a swing trade.
The RSI is very simple as it works with clear numbers. If a cryptocurrency is overbought then this indicator is above 70, if it is oversold then it is below 30. Often it works well if you buy around 100 and sell around 0, so you have more margin.
Even when swing trading, it is helpful if you also have a volume indicator in your chart so you know how significant a trend is. Large volumes have much more impact on the trend.
Suppose you hit a cross on the MA, the RSI is at 100 and volumes are high, then you have enough signals together to place a trade.
In both swing and day trading you will find that the more often you do it, the better you get at it. Logically then you start with much lower bets and as you get better you bet less often and use higher amounts.
"The market is a device for transferring money from the impatient to the patient."
Advantages and disadvantages of using indicators
There are clearly more advantages than disadvantages to using indicators. It does take some work, but your understanding of the crypto market will increase little by little, in addition to the better results.
Pros
- By working systematically with indicators, you learn to recognize the signs of such an indicator quickly and also know immediately what to do.
- By using popular indicators, you will respond to the same signal more often than a lot of other traders, so together you will start to influence the price in a way that is favorable to you. Power by numbers.
- When you look at indicators more often, you learn to better understand the crypto market and its jumps, and you get an idea of where prices are coming from and where they are going.
- By using the right ratio of stop loss and take profit, you can end up being one of the few winning investors in the field.
- When tightly following an indicator, you turn off emotion, which makes you less likely to make poor decisions.
- If you use indicators you also see what trend there is recently, without it you have almost no idea what has happened in the crypto world recently.
Cons
- At first, working with indicators can be intimidating.
- Signals from within the market may be overshadowed by events outside the crypto market, such as a recession or an interest rate cut.
- You need to figure out a winning strategy or trading system before you start working with indicators.
- Becoming an expert in an indicator takes time.
Conclusion

If you are going to invest in cryptocurrency, indicators are a very useful tool. The longer you work with them, the better you will understand them. The better you understand them, the more successful you will become when you make smart use of indicators. A trading journal can help you by showing you which trades are working and which are not.
In the beginning, don't be put off by any indicator and don't start working with the most complex ones right away, such as the Ichimoku Cloud. Start with indicators that give simple indications, such as the RSI or Moving Averages, but which are widely used. That way, you can quickly learn how they work, you have a good chance that they work, and you have a clear handle on the complex world of cryptocurrency with minimal effort.
"Do more of what works and less of what doesn't."


