Technical Analysis Starter Guide – Frequently used terms to get you started
- 5 minute read

Technical analysis (TA) might be unknown territory for some, for some investors it is complete nonsense, while others swear by it and use it to predict the market. TA is in essence a strategy that an investor can apply to a chart, attempting to predict the future performance of a coin. In other words, investors can use technical analysis. To identify the best possible entry or exit point.

The most common terms in TA
There is a wide variety of techniques and tools you can use to analyse a chart. We have compiled a list of the most commonly used TA for you.
Trend:
In the financial world, 'The trend is your friend' is a catch phrase. The trend is the general direction in which the price of a cryptocurrency moves. You have three types of trends:- Up; this is a series of higher highs and higher lows.
- Down; this is a series of lower highs and lower lows.
- Sideways; these are approximately equal highs and lows.
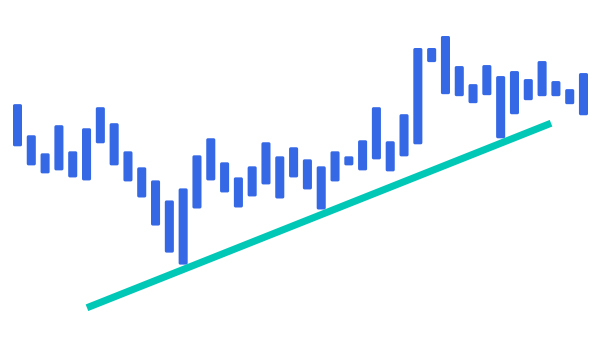
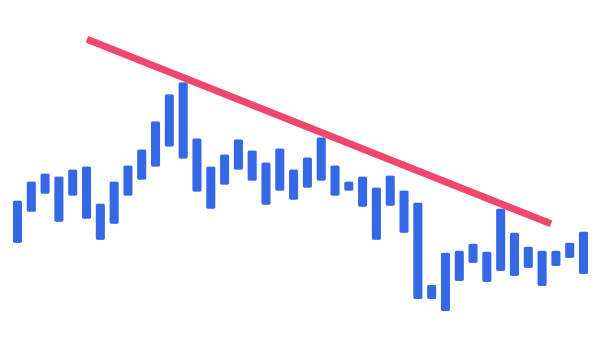
The trend can be an important factor because many investors think that a currency will generally continue to move in the same direction. Thus, a cryptocurrency which has a strong upward trend will, according to the reasoning of the investors - who use technical analysis - continue to rise. Vice versa, the expectation is that the price will keep falling when there is a strong downward trend.
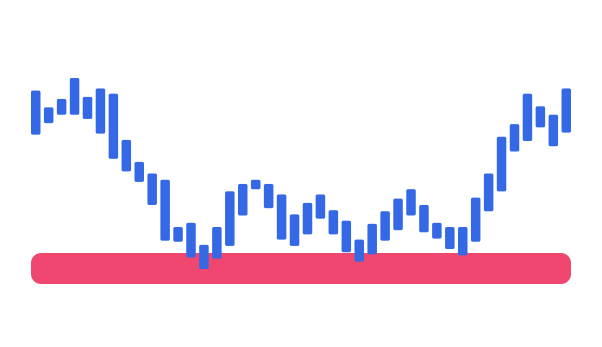
Support & resistance niveaus
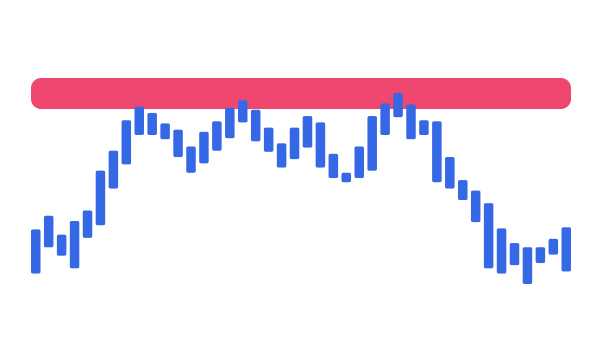
Some investors draw lines to connect highs and lows. These lines are known as support and resistance levels.
Support and resistance indicate price levels cryptocurrencies have trouble breaking through. This can be a signal to enter or exit a crypto if it breaks through its support or resistance.
Picture this: Bitcoin breaks through its resistance, which is a level that Bitcoin has repeatedly bounced back from in the past. Because Bitcoin has broken through its resistance, this signifies to an investor that it could be a potentially good time to enter. On the other hand, if Bitcoin falls through its support, the price may continue to fall, meaning that this could be a good time to pull out (part of) your investment.
On the other hand, if Bitcoin falls through its support, the price may continue to fall, meaning that this could be a good time to pull out (part of) your investment.
Price patterns
If you connect the support and resistance levels on the chart, you get price patterns. The price movement of a crypto may resemble a certain form. These shapes are called price patterns.
Price patterns are an extension of support and resistance lines, which investors use to try to predict more specific price movements and to find even better buying and selling opportunities.
There are various price patterns which come in different shapes and sizes. For instance you have patterns in the shape of triangles, flags, wedges and the well-known head and shoulders pattern.
Technical indicators
Drawing lines and patterns can be subjective. What may be a perfect triangle from your perspective may be the beginning of a head and shoulders for someone else.
Technical indicators are graphical representations of chart data. Indicators can display price and volume in a unique way, allowing investors to view the performance of a cryptocurrency from a different perspective.
These indicators are created using formulas and data. This allows investors to determine the price of a crypto in a more objective way.
A well-known indicator is the Moving Average (MA) line. This indicator shows the average price of a crypto over a period of time. The trend of the price can be determined with this indicator. MA's can be calculated over any period. The most common periods are the 50 days and the 200 days Moving Average.
When a crypto is above its MA, it may be a good entry point, as the trend shows a reversal. After all, it is performing above average. Vice versa, it can be a good exit moment if the price of a crypto drops below its MA.
Closure
There is a reason why most (successful) investors use TA. It gives you an advantage in identifying the market and making a trade. However, be cautious. Technical analysis's often fail because they are subjectively interpreted. Never blindly trust a TA of one person and use it only as potential advice.
Check out our cryptocurrencies overview