How can fundamental analysis help predict the price of crypto?
- 7 minute read

There are several ways to analyze and predict the price of Bitcoin and other cryptocurrencies. Technical analysis tries to predict the price by using price data such as candlestick patterns, support and resistance lines, trend lines and a variety of other indicators while fundamental analysis focuses on the valuation of a crypto-currency by its possibilities of use, number of users, the team, etc. A fundamental analysis can be done by an on-chain analysis. But what exactly is on-chain analysis? And how can it be used in cryptocurrency valuation?
Table of Contents
- What is Fundamental Analysis?
- What is On-Chain Data?
- Rich List
- Daily active addresses & Daily transactions
- Bitcoin Miners
- Conclusion
Key Takeaways
- A fundamental analysis can be done using on-chain data.
- 'Rich lists' can be used to see what action whales take.
- The on-chain data shows that Bitcoin balances on exchanges are getting lower and lower.
- The on-chain data shows that the number of active Bitcoin addresses and transactions have remained fairly stable.
- Bitcoin miners have been reducing their Bitcoin reserves in recent months.
What is Fundamental Analysis?
Fundamental analysis is an analysis that investors use to identify opportunities in the market based on fundamentals. Fundamental analysis calculates the underlying value of an asset. For example, at a company this can be done by means of all kinds of financial data such as the balance sheet, profit and loss account and budgets. With a cryptocurrency, this can be done by looking at all kinds of properties and statistics of the coin. Consider, for example, the current market capitalization or on-chain data.
What is On-Chain Data?
On-chain data is all information that is publicly available because transactions take place on the blockchain. All data on the blockchain is transparent and freely accessible to everyone. This allows transactions to be observed. This can be done, for example, by means of a 'blockchain explorer'. On-chain data can then be obtained by observing these transactions on the blockchain. You can easily track individual transactions for Bitcoin yourself through the Blockstream explorer and on Ethereum through Etherscan. But other networks also have their own block explorer.
There are also companies that specialize in on-chain data such as Glassnode, CryptoQuant or Nansen. These companies process large amounts of data from the blockchain and visualize this in all kinds of ways. From this, a lot of on-chain indicators can be developed that can be used in analyses. By doing an on-chain analysis you could be one step ahead of the market and the price might be better predicted. We will now take a look at some of these on-chain indicators and discuss how they might affect price.
Rich List
With every cryptocurrency you can often see a 'rich list'. This rich list consists of the top 25-100 wallets on the network with the largest balances. For example, BitInfo shows the top 100 Bitcoin wallets and their balances, how many transactions have been made and when a transaction was last made. Since these whales have the most influence on the price, it is important to monitor their actions. Are they selling or buying? If large amounts of cryptocurrencies are sent to exchanges by whales, you can logically assume that they will be sold. You can respond to this as an individual investor. Although, of course, large transactions to exchanges do not mean that a price crash is always imminent.
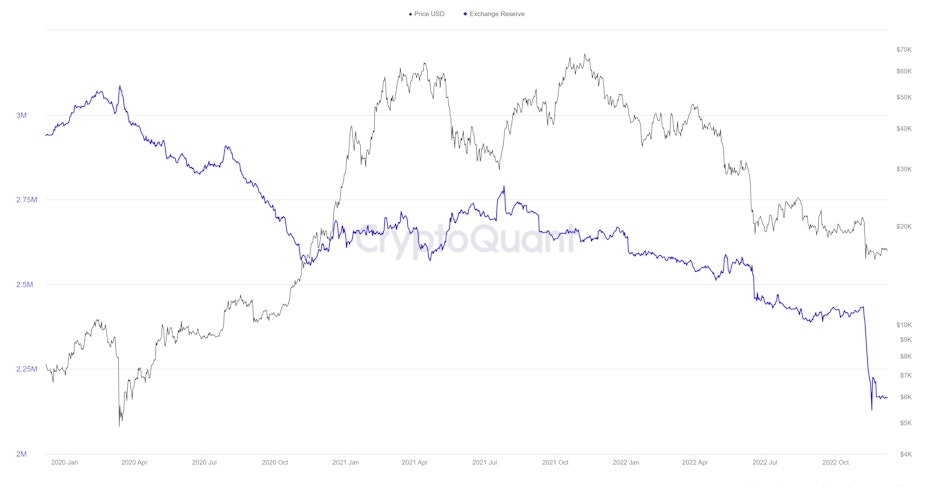
This brings us to an important indicator for on-chain analytics: the balances on exchanges. Since exchanges are where the price is set by buyers and sellers, it is important to monitor the size of the balances on these exchanges. These will be the coins that investors can immediately sell. If we look at these balances on Bitcoin exchanges, we see that they have been declining in recent years with some periods of increases or stagnation in between. This is a signal that can be considered as bullish. Could these dwindling balances on exchanges be the start of a new bull market?
In recent weeks, a lot of Bitcoin has been withdrawn from exchanges in particular. According to CrytpoQuant and Glassnode, that many Bitcoins have never been withdrawn from exchanges in such a short time ever before. This is probably due to all the chaos in the market and the fear that exchanges will not be able to meet their obligations to users after the demise of FTX. Many users want to avoid losing control over their Bitcoin and remove it from central parties. The following graph shows the Bitcoin balances on exchanges from the beginning of 2020, according to CryptoQuant.
Daily active addresses & Daily transactions
When Facebook was founded in 2004 by Mark Zuckerburg and his classmates, the network had little value. There were just a few users in the first years. If few users are active on a network, you can only connect with a few other users. The more users a network has, the greater the value of this network becomes. In fact, Metcalfe's law states that the value of a network increases exponentially with the number of users. This is due to the possible number of unique connections. Due to this exponential factor, the network effects are included in the valuation of a network.
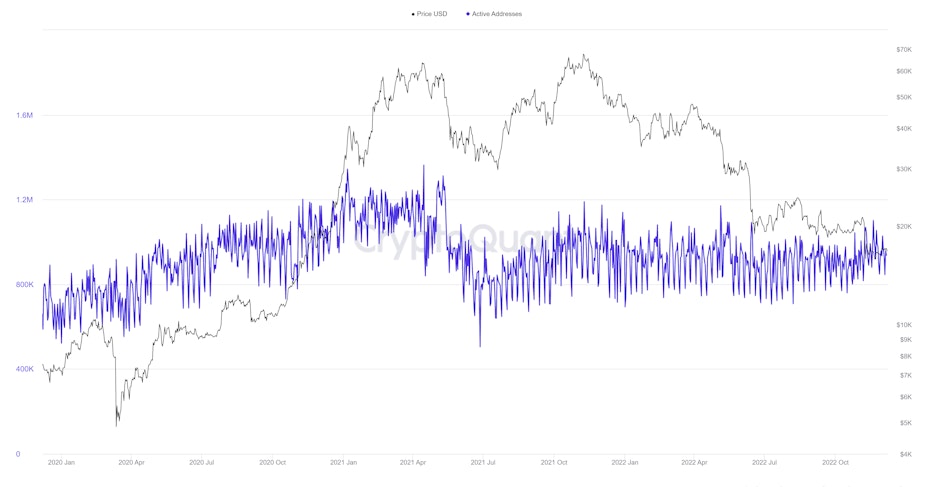
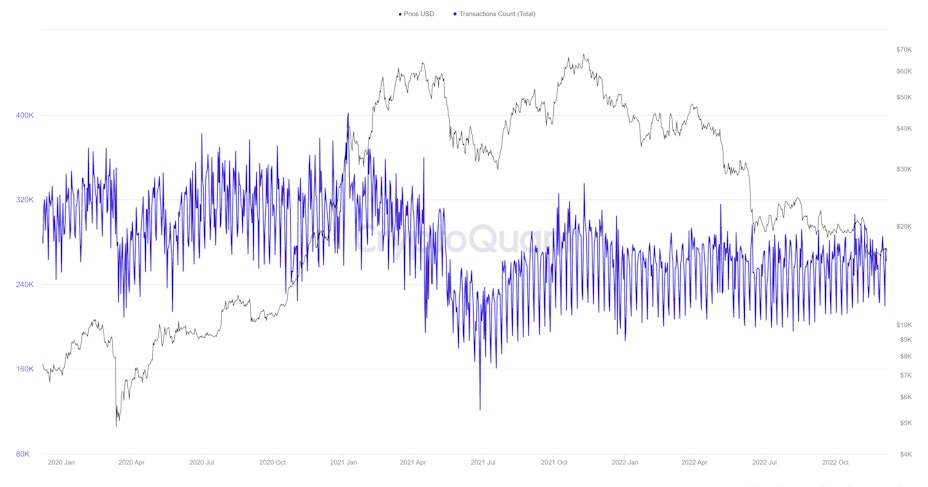
Metcalfe's law is also often observed when valuing cryptocurrencies. The value of a network increases the more it is used. The extent to which a network is used largely depends on the number of addresses that are active and the number of transactions that are carried out. These will therefore be important on-chain indicators when you want to do a fundamental analysis of a network.
If we look at the daily active addresses on the Bitcoin network, we see that they remain fairly stable according to CryptoQuant. It even seems to be rising slightly in recent months. At the time of writing, more than 262,000 addresses are active every day. If we look at the number of transactions on the Bitcoin network, we see that this has decreased compared to 2020, but is stable or even increased compared to 2021. Although the price of Bitcoin has fallen in recent months, the on-chain activity seems fairly positive.
Bitcoin Miners
The prices of listed companies that specialize in mining Bitcoin such as Hut 8 and Marathon have fallen by more than 90% and are therefore not doing too well. Bitcoin miners depend on several factors. Think of the price of Bitcoin, the difficulty of mining Bitcoin and the cost of electricity. All of these factors have developed negatively for miners in the last year: the price of Bitcoin has dropped about 75% since its peak, the difficulty level - which is influenced by the hashrate - has increased significantly, and the cost of energy has risen quite a bit.
Bitcoin miners have a major influence on Bitcoin price development. About 900 Bitcoin are mined every day. At a price of $17,000 per Bitcoin, this would equate to selling pressure of more than $15 million per day if everything were to be sold on the market. Whether the miners go for a HODL strategy or sell this BTC is therefore of great importance for the Bitcoin price.
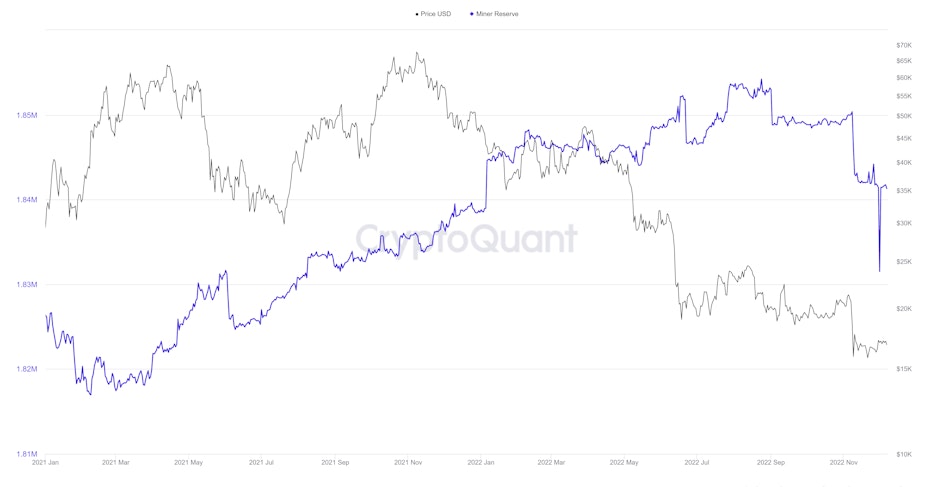
The bad developments in the price, increased difficulty and cost of electricity have probably led many companies active in Bitcoin mining to sell their coins to meet various financial obligations. Whereas Bitcoin miners mainly showed a HODL strategy last year and accumulated Bitcoin, that has changed somewhat in recent months. As seen below, miners have been selling their reserves since July 2022 according to CryptoQuant. This will therefore have contributed to the falling price of Bitcoin in recent months. Thus, if we see accumulation in Bitcoin miners' reserves again in the future, it would be a possible precursor of more positive price developments.
Conclusion
On-chain data can be an important part of conducting a fundamental analysis. Numerous indicators have been developed to analyze the behavior of others on the blockchain. This provides benefits that allow people to better understand the market and make better decisions. Although it is not always easy to draw conclusions from the data and some things only become clear once the price action has already taken place, an extra analysis tool can do no harm in this volatile market.


